Unemployment and income inequality in the USA
Quick version
- Unemployment differs widely by race, with Black and Hispanic Americans more likely to be unemployed.
- President Biden’s American Jobs Plan helped reduce post pandemic unemployment.
- By the end of Biden’s term in December 2024, unemployment had risen again.
- In 2025, President Trump introduced tariffs and an executive order expanding skilled trade training, apprenticeships, and education programmes.
- Job creation slowed in 2025 from 168,000 per month to 49,000 per month, and unemployment rose to 4.55 in November 2025.
- Income inequality is significant, with 2022 median household incomes ranging from $52,860 for Black Americans to $108,700 for Asian Americans.
- The US Government supports low income families through TANF, SNAP, and the EITC.
- The 2025 One Big Beautiful Bill Act increased some tax benefits but cut welfare programmes.
Learn more
Keep going to learn:
- Unemployment rates
- President Biden and unemployment
- President Trump and unemployment
- Income and poverty rate inequalities in the USA
- How is the US government tackling poverty and low income?
Then test how much you have learned.
Unemployment rates
In December 2025, the national unemployment rate in the USA was 4.4%:
- This is considerably lower than when the US economy and jobs were badly affected by the Covid pandemic.
- This is higher than the average unemployment rate (4.1%) during Joe Biden's presidency.
(Source: U.S. Bureau of Labor Statistics)
There is a wide difference in unemployment rates between different ethnic groups:
Unemployment rates (%) by racial group, Dec. 2025 (seasonally adjusted)
| Racial Group | White | Hispanic | Black | Asian |
|---|---|---|---|---|
| Percentage (%) | 3.8 | 4.9 | 7.5 | 3.6 |
Unemployment rates between different racial groups
There are different and complex reasons which explain why Black and Hispanic Americans are more likely to be unemployed. These include:
- People from poorer areas tend to have lower education levels. This is more likely to affect people from Black or Hispanic backgrounds who are statistically more likely to live in poorer areas and have fewer qualifications.
- Discrimination – Studies show that job applicants with identical job applications with names which sound white are more likely to receive a callback than those which sound Black or Hispanic.
- A greater percentage of people from minority groups have less access to affordable transport allowing them to take the jobs which do become available.
President Biden and unemployment
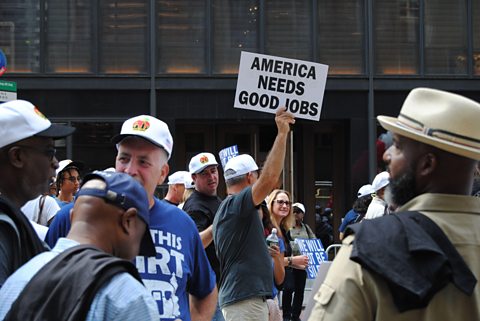 Image source, Erin Alexis Randolph / Alamy
 When the Covid pandemic hit the USA in 2020, millions of Americans lost their jobs and unemployment rose sharply reaching just over 14%.
(Source: BBC News)
On taking office in Jan 2021, one of President Biden’s highest priorities was to get those Americans who had lost their jobs because of the pandemic back into work.
His administration’s plan, the American Jobs Plan (AJP), looked to create more jobs through a 10 year $2 trillion investment programme of building roads, railways, and bridges, extending airports and ports, and extending high-speed internet capacity.
By March 2021, thanks in part to the AJP, the US unemployment rate had more than halved to 6.2% .
Unemployment continued to fall, and remained between 3.4 and 3.6% between May 2022 and July 2023.
Since then unemployment has risen, reaching 4.1% by December 2024, when Biden's presidency ended.
Image source, Erin Alexis Randolph / Alamy President Trump and unemployment
 Image source, Alex Wong / Getty Images
 In 2025, President Trump introduced tariffs (taxes) on goods reaching the US from countries around the world.
Trump says tariffs increase the amount of tax raised by the government, encourage consumers to buy more American-made goods and boost investment in the US. He argues that this policy will boost American manufacturing and create jobs.
It could be argued Trump's main policy to reduce unemployment is through economic growth.
In April 2025, President Trump signed an executive order Preparing Americans for High-Paying Skilled Trade Jobs of the Future.
This policy aims to
- increase the number of apprenticeships
- modernise and increase the range of education and training programmes
- work with industry to focus training on growing areas of the economy (eg artificial intelligence)
- focus training on long-term unemployed and underemployed communities
Critics argue that Trump's tariff policy, and uncertainty about his economic policy will weaken the US economy.
During Trump's first year in office (2025) unemployment has continued to rise, reaching 4.5% in November 2025 before falling slightly to 4.4% in December.
Job creation has fallen from 168,000 per month under President Biden in 2024, to 49,000 per month in 2025.The pace of job creation
The increase in the unemployment rate has been limited by Trump's policy on immigration, deportation and enforcing rules on employing non-US citizens.
(Source: Reuters)
Image source, Alex Wong / Getty Images Income and poverty rate inequalities in the USA
There are huge income and poverty inequalities in the US. Poverty affects a greater percentage of Black and Hispanic Americans than white and Asian Americans.
White and Asian Americans are more likely to be wealthy and have lower poverty rates than Black and Hispanic Americans.
Median household White Americans income was around $81,060 in 2022 compared to just $62,800 for Hispanic Americans and $52,860 for Black Americans. Asian American median household income was the highest in 2022 at $108,700.
Median household income ($) levels by racial group, 2023
| Racial Group | White (non-Hispanic) | Hispanic | Black | Asian |
|---|---|---|---|---|
| Average household income ($) | $89,050 | $65,540 | $56,490 | $112,800 |
(source: US Census Bureau)
Poverty rates, on the other hand, are higher, on average for Black and Hispanic Americans compared to White and Asian Americans.
Poverty rates (%) by racial group, 2023
| Racial Group | White (non-Hispanic) | Hispanic | Black | Asian |
|---|---|---|---|---|
| Poverty rate (%) | 8.6 | 16.9 | 17.1 | 8.6 |
Income and poverty inequalities between different racial groups
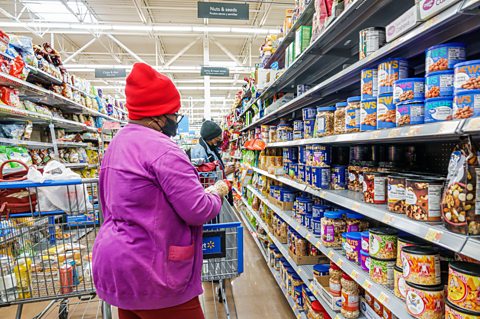 Image source, Jeffrey Isaac Greenberg 13+ / Alamy
Income is closely linked to education levels.
In 2022, the median weekly income for those aged over 25 years with the highest educational qualification, a doctoral degree, was $2,083.
This compares starkly with the median weekly income for those over the age of 25 years with the lowest educational qualifications, less than high school diploma, which was only $682.
As white and Asian Americans more often achieve better educational qualifications than Black and Hispanic Americans, this partly explains the income differences between racial groups.
(Source: U.S. Bureau of Labor Statistics)
Conversely, a lack of education is linked to greater poverty rates. As Black and Hispanic Americans tend to have lower educational qualifications than white and Asian Americans, the poverty rates for these groups are higher.
Image source, Jeffrey Isaac Greenberg 13+ / AlamyHow is the US government tackling poverty and low income?
There are many ways in which the US government looks to support those on a low income. About 19% of US federal government spending ($1.215 trillion) goes on welfare programmes.
Temporary Assistance for Needy Families (TANF)
This is a benefit that helps families when the parents or carers cannot provide for the family’s basic needs. The federal government gives money to individual states for this, and they can then decide the amount of payments. TANF cost the US taxpayer $15 billion in 2022.
States have used the money to provide extra cash to families, childcare, education and job training and transport to and from job interview for parents.
Supplemental Nutrition Assistance Program (SNAP)
This is another benefit for needy families. It is given so that families can buy healthy food. It is given in the form of a debit card for families to use in shops that have signed up.
Most food can be bought using SNAP, except food that is bought hot. In addition, you cannot buy alcohol, cigarettes, medicine, or hygiene items.
In 2022, the SNAP cost the US taxpayer $148 billion.
Earned Income Tax Credit (EITC)
EITC is a federal government benefit for low income working people. It is like tax credits in the UK. EITC reduces the amount of tax paid and it may also give a refund. Along with child tax credits, another benefit to support families who requires support, tax credits cost the US taxpayer around $196 billion in 2022.
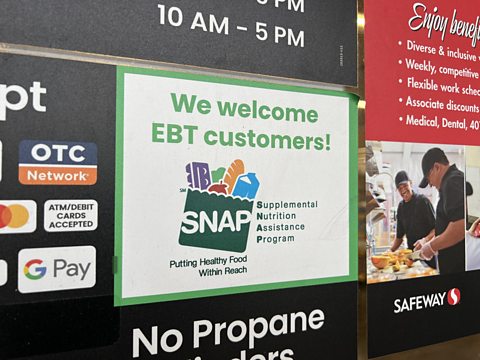 Image source, Smith Collection/Gado/ Getty Images
President Trump and poverty reduction
President Trumps main focus on reducing poverty is through growing the economy. In July 2025, Trump signed into law the One Big Beautiful Bill Act, containing a number of tax and spending policies.
The act includes several measures that could help families living in, or near, poverty:
- tax reductions for tips and overtime pay could increase income for some workers
- creating Trump accounts allows parents to set up savings accounts to benefit their children, for which tax payment is delayed until a later date
- Child Tax Credits (which provide financial assistance for families raising children) have been raised from a maximum payment of $2,000 to $2,200 per child.
The act includes measures that could increase problems for families living in, or near, poverty:
- cuts to welfare programmes including TANF, SNAP and EITC will result in reduced payments to some, who will have to support themselves on a smaller income.
- cuts to Medicaid will mean that more people do not have health insurance coverage and will need to meet healthcare costs themselves. More people will have to take on some health costs as they will have to contribute a share to costs.
- changes to who can claim benefits and tax credits mean that children who are US citizens may not be eligible for benefits if their parents do not have a social security number.
Based on projections from the Congressional Budget Office (CBO), the OBBBA will affect different economic groups differently:
- the wealthiest ten percent of households will see an increase in their resources of $13,600 on average annually
- middle income households will see an average increase of $800 to $1,200 per year
- the poorest ten percent of households will be an average reduction of $1,200 per year
(Source: Congressional Budget Office)
Quiz
Recap what you have learned
Unemployment rates differ widely between racial groups, with black and Hispanic Americans more likely to be unemployed due to factors such as lower average educational attainment, discrimination in hiring, and reduced access to affordable transport.
In 2021, post Covid 19 pandemic, President Biden created the American Jobs Plan, which contributed to lowering unemployment by more than half to 6.2% by March 2021 and it continued to fall.
By the end of Biden’s presidency in December 2024, unemployment had risen again to 4.1%.
Under President Trump in 2025, tariffs on foreign goods and a focus on stimulating US manufacturing were introduced.
Preparing Americans for High-Paying Skilled Trade Jobs of the Future, was his executive order to expand skilled trade training, apprenticeships, and education programmes.
Job creation slowed in 2025 from an average of 168,000 new jobs per month in 2024 to 49,000 per month in 2025, while unemployment rose to 4.5% in November 2025 before edging down to 4.4% in December.
Significant income inequalities persist: in 2022, median household incomes ranged from $52,860 for black Americans to $108,700 for Asian Americans.
There are higher poverty rates among Black and Hispanic communities.
The US government tackles poverty through welfare programmes such as TANF, SNAP, and the EITC.
In 2025 President Trump’s One Big Beautiful Bill Act both increased some tax benefits (like Child Tax Credits) and cut several welfare programmes, with the poorest households projected to lose around $1,200 per year, while the wealthiest gain substantially.
More on World power: USA
Find out more by working through a topic
- count10 of 10
- count1 of 10